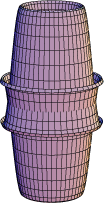


SurfaceOfRevolution[
x^3/5Sin[8x^3 Sin[x]] - Cos[10x] + x,
{x, -Pi/8, Pi/8},
ViewPoint -> {1.5, 1, 1.5},
PlotPoints -> {100, 50},
Boxed -> False,
Axes -> None]
SurfaceOfRevolution[
12x/7Sin[9x*2] - Cos[9x] + 2x*2,
{x, -Pi/6, Pi/9},
ViewPoint -> {0.5, 1.5, 1.5},
PlotPoints -> {100, 50},
Boxed -> False,
Axes -> None]
SurfaceOfRevolution[
2x/6Cos[7x*x] - Sin[10x] + x,
{x, -Pi/4, Pi/4},
ViewPoint -> {3.5, 5, 1.5},
PlotPoints -> {70, 50},
Boxed -> False,
Axes -> None]
 卜部東介研究室に戻る