|
|
 |
 |
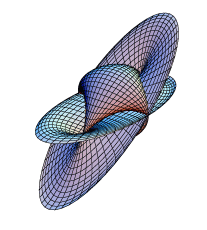
These are computer graphics for the end-of-term assignment submitted by second-year students attended the subject "Introduction to Geometry" at Department of Mathematical Sciences, Ibaraki University. The lectures were given in the latter half of the 2002 academic year by Tohsuke Urabe. Below a graphic we write commands of the symbolic manipulation program Mathematica for generating it. After 25 graphics pages, we have the epilogue. | ||
 |
 |
 |
|
| ParametricPlot3D[ {10/(1 + 1/u)*(Cos[u] + 3)*Cos[v], 10/(1 + 1/u)*(Cos[u] + 3)*Sin[v], u*Sin[v]}, {u, Pi/10, 70Pi}, {v, 0, 2Pi}, ViewPoint -> {2, 2, -2}, PlotPoints -> {50, 50}, Boxed -> False, Axes -> None] |
ParametricPlot3D[ {2Cos[x] * Sin[y] * Cos[Sin[x]], Sin[x] * Cos[y] * Sin[Cos[x]] , x * y}, {x, -Pi, Pi}, {y, -Pi, Pi}, PlotPoints -> {50, 50}, Boxed -> False, Axes -> None] |
ParametricPlot3D[ {Cos[psi] Cos[phi]/(2 Exp[Sin[phi]]), Sin[psi] Cos[phi]/(3 Exp[Sin[phi]]), Exp[Sin[phi]] Cos[psi]}, {phi, 0, 2 Pi}, {psi, 0, 2 Pi}, PlotPoints -> {50, 50}, Boxed -> False, Axes -> None] |
ParametricPlot3D[ {Cos[u] Cos[v], Sin[u] v , Sin[u] Cos[v]}, {u, -Pi, Pi}, {v, - Pi, Pi}, PlotPoints -> {50, 50}, Boxed -> False, Axes -> None] |
 Back to Tohsuke Urabe Laboratory