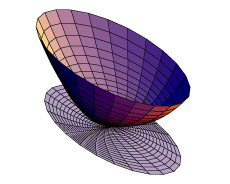


{u^2 Cos[t],
u Sin[t],
Exp[u]},
{t, - Pi, Pi},
{u, -Pi, Pi},
PlotPoints -> {25, 50},
Boxed -> False,
Axes -> None,
AspectRatio -> 0.8,
ViewPoint -> {3.285, -1.154, 5.583}]
{u^2 Cos[t],
u Sin[t],
u},
{t, -Pi, Pi},
{u, -Pi, Pi},
PlotPoints -> {25, 50},
Boxed -> False,
Axes -> None]
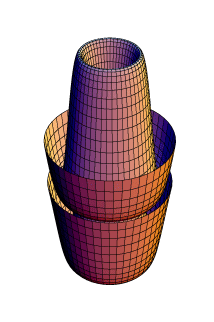
SurfaceOfRevolution[
3x/5Sin[8x*x] - Cos[10x] + x,
{x, -Pi/4, Pi/4},
ViewPoint -> {1.5, 1, 1.5},
PlotPoints -> {100, 50},
Boxed -> False,
Axes -> None]
SurfaceOfRevolution[
Exp[u]/2 + Tan[u]/5,
{u, -Pi/2 , Pi/2},
PlotPoints -> 50,
Boxed -> False,
Axes -> None]
 卜部東介研究室に戻る